Yearly review: Looking back at 2025
- Published on
- Reading time
- 11 min read
- Category
- Year in Review
It’s that time of the year again! The new one has just started, and the previous one is completed. You know what that means: It’s time for my yearly review of 2024.
As always I’ve collected some data on how my websites performed over the last year and want to share some insights with you. So let’s dive right into it!
My portfolio: pawcode.de
We’ll again start with my personal portfolio at pawcode.de. This is where I showcase all of my projects that I worked on over the years. By now it’s been so long that some of the projects are even considered “legacy” and they’re already archived. So there is a new section for these projects in the list now. But that’s not the only thing that’s new this year.
It was also time to do another rewrite of the website. As announced two years ago in my yearly review of 2023, I wanted to move away from Angular. Server Side Rendering (SSR) with Angular worked fine for me at the time, but I always wished for a more lightweight and more performant solution. Last year I then enabled partial hydration to minimize the amount of JavaScript sent to the client. But the response times were still not as good as I wanted them to be (partly due to cold boot times of the Vercel edge function).
So I finally decided to rewrite the portfolio (again) with Astro. It now checks all the boxes for me:
- It’s fast (both in development and production) due to its static site generation (SSG) approach out of the box. No more cold boots, just static assets served via a CDN.
- It has a great developer experience for content heavy websites that don’t need much interactivity.
- It allows me to use my own astro-loader-pocketbase to fetch project data directly from PocketBase at build time. This way I could re-use all of the data I already had in the previous version.
The only thing that’s missing right now is a switch to SSR instead of SSG. This would allow me to update project data in realtime without needing to trigger a complete rebuild of the website. But since my project data does not change that often, I am fine with the current setup for now.
Also feature-wise, the rewrite was a huge improvement. I now added support for:
- Dark mode (finally no more bleeding eyes 😎)
- Internationalization with German and English for all international visitors
- Improved accessibility with high contrast mode and better screen reader support
But enough about the technical details, let’s talk numbers:
Visits, views and other general stats
Page views
The final visitor count clocked in at 890 visitors in the last year with a total of 1247 page views. That means the average number of visits per month was around 75. All of this marks a nice increase of around 70% compared to last year!

Project clicks
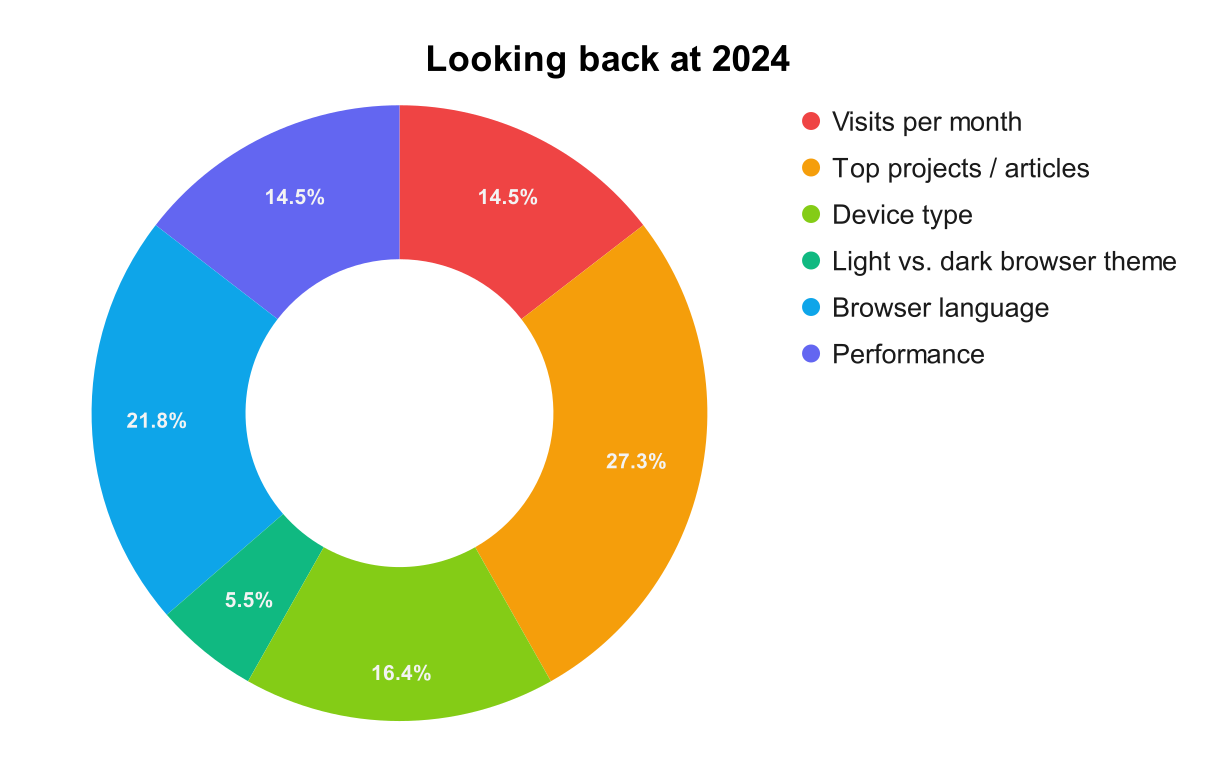
Another thing that I’m always interested in is which projects the people are actually looking at. Last year I said that my focus was shifting more towards open source projects rather than client work. This trend continued in 2025. Besides the portfolio rewrite, there was no closed source work done this year (except my day job of course). And I also worked on a new Android app after years of inactivity. All of this is reflected in the views grouped by project category.
The most viewed category is actually tied between Websites (39.9%) and Open Source (39.4%), followed by Android Apps (20.7%). The later one got a huge boost thanks to my new app CardStore, which I will also talk about in more detail further down.
On a more granular level, here are the top 5 projects (by their views):

I kept the colors grouped by category similar to how they are on my website.
Users and their preferences
After the look at what people do on my website, it’s always interesting to see who these people are. Disclaimer: There is no personal data being collected. There is only general information like browser type, preferred language, device type, etc. The data is not used for marketing or advertising. It’s only used for this yearly post and to improve the websites.
Device types
One of the first things I want to look at is the device type of my visitors. I can use this information to optimize the website for the most common devices. In addition, the screen size allows me to check if my responsive design is working as intended and to scale images properly in different resolutions.
To not go into too much detail with different screen sizes, here is a graph of the different device types instead:

As always the desktop (or laptop) is still the most dominant device type with around 80% of all visitors. But like the previous iteration of my portfolio, this one is also optimized for desktop viewing.
Used Theme
Since I personally prefer dark mode on most websites and apps, I finally added support for it on my portfolio as well. The demand for it was not that high with around 1/5th of my visitors having a dark theme preference in their browser or device. But now that it’s available it will be automatically applied for these users (though they can still switch on the website themselves).

The split between light and dark theme is still around 80/20, but at least everyone can now choose what they prefer. And in addition both themes now also support high contrast mode for better accessibility. So you could also say that my portfolio now supports 4 different themes.
Language preference
And as always the final statistic (about this website) is the preferred language of my visitors. For the past years the majority of visitors preferred English, even though my portfolio was only available in German. With the new version I finally translated everything into English as well to allow even more people to read about my projects. With more projects being open source and available for an international audience instead of local clients, this felt like the right decision.

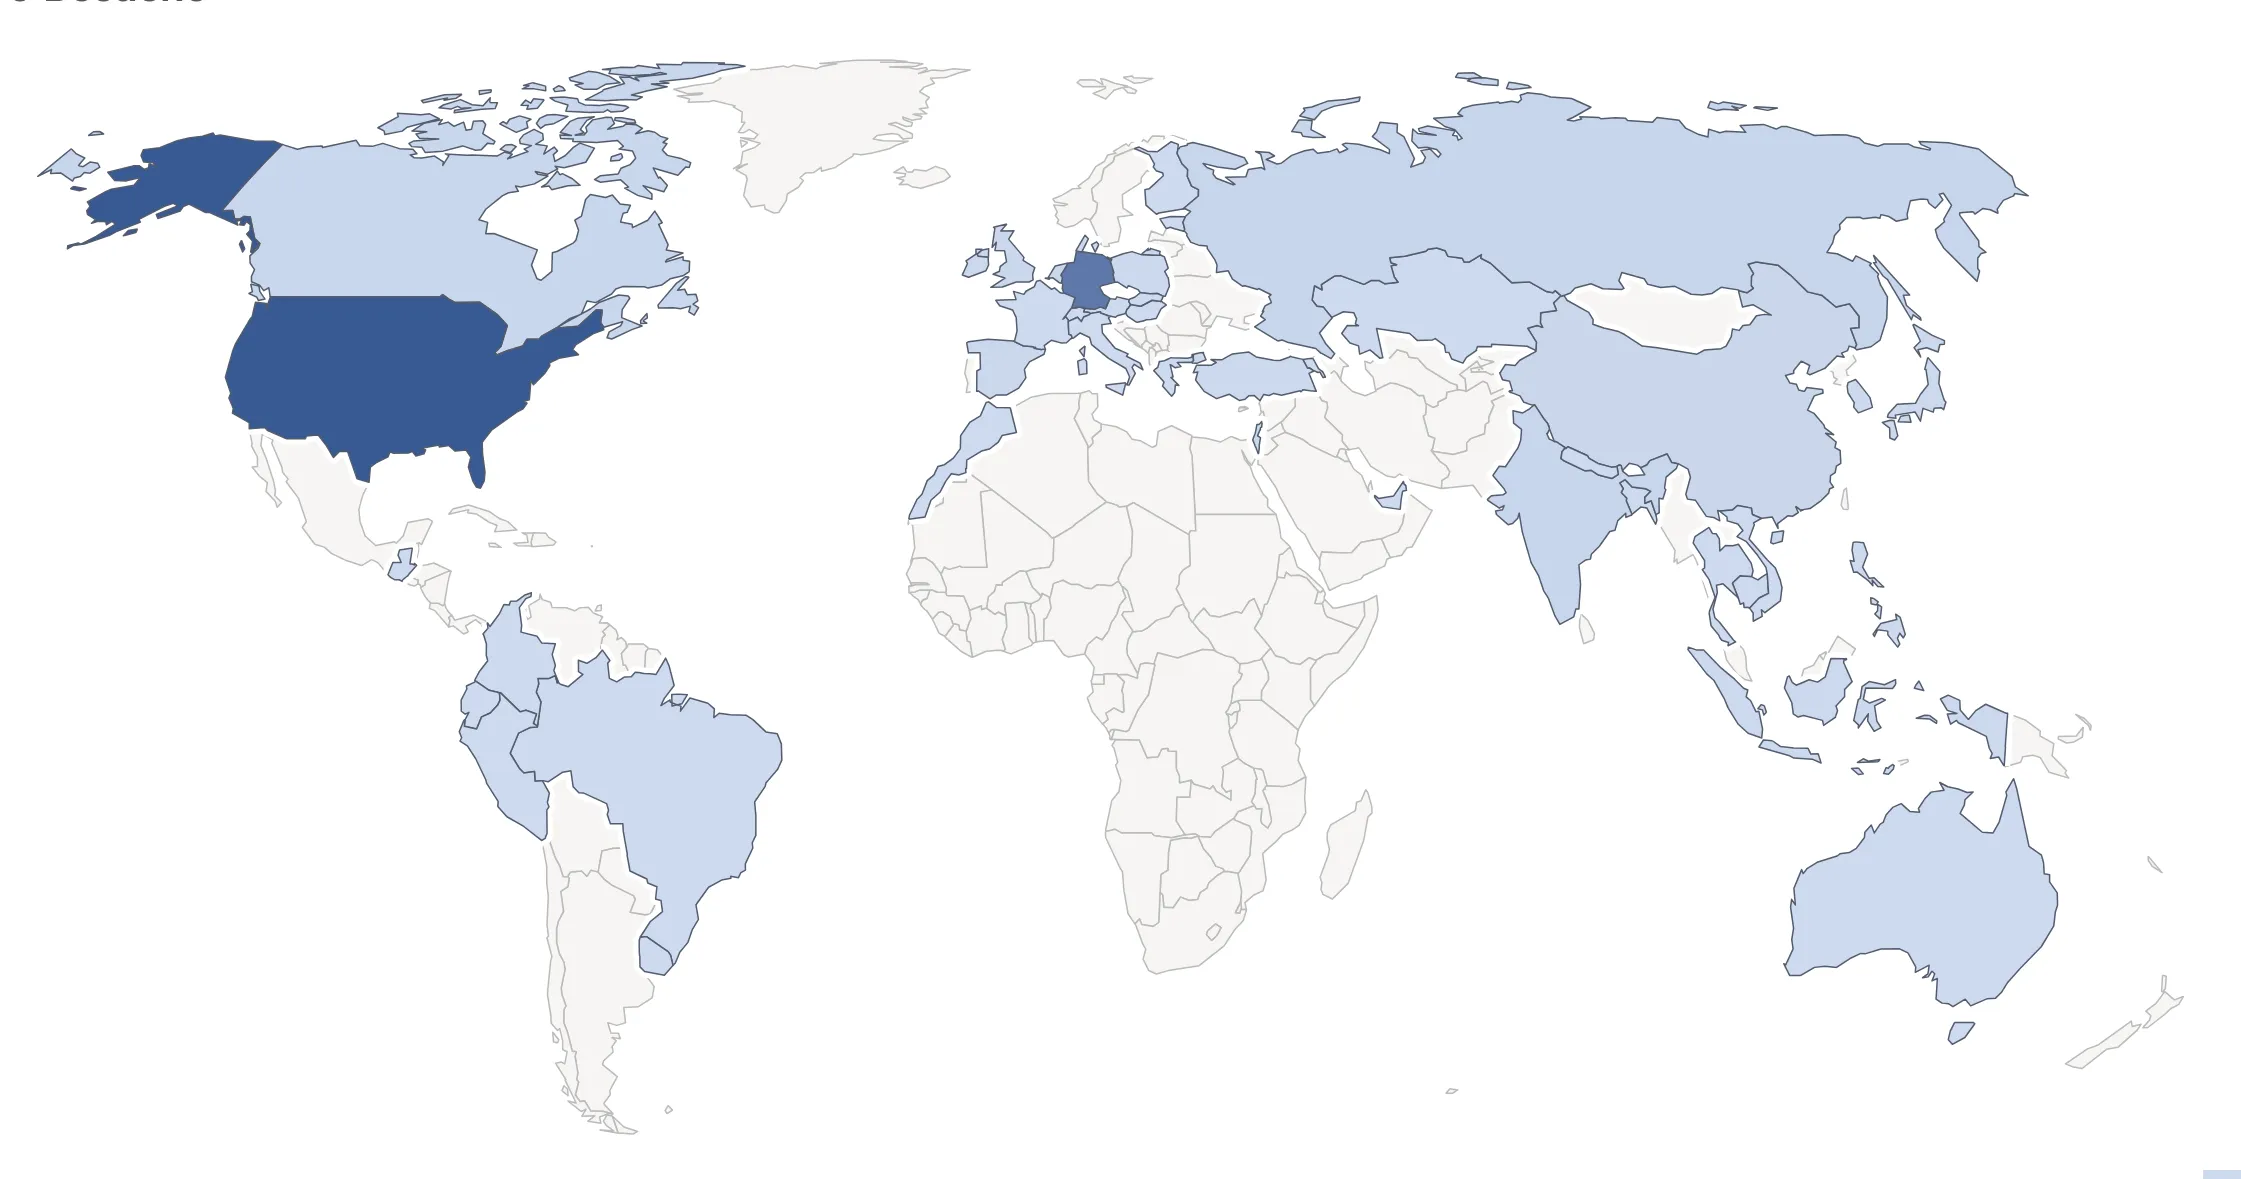
As you can see, it was definitely the right decision with 78% of my visitors preferring English.
Printed on a world map it looks like this:
Speaking of English, this blog is only available in English. So let’s move on to the next section:
My blog: blog.pawcode.de
In contrast to my portfolio, the blog is already performant enough, running Astro with SSG and the built in Markdown rendering. But there were still a few improvements to be made:
- The UI got a glow up with new fonts (yes, you can switch between a serif and a sans-serif font now)
- I introduced new pages to view all posts by their tags and added a category system to group similarly written posts together
- The posts themselves got some new features with:
- Table of contents with desktop and mobile layouts
- Summarizer chat built with Google Chromes new API (checkout the post about it)
- Share button for social media and print button to get a paper friendly version of the post
- Links to related posts at the end of each article to keep readers engaged
So now people can customize their reading experience with even more options than just light and dark mode. Let’s see how these improvements affected the blog stats:
Visits and views
Page views
In total, I could gather data for 633 visitors, with a total of 702 page views. This marks a huge increase of around 230% compared to last year and puts the average number of visits per month at around 25 in the beginning of the year and 60 in the second half of 2025. I’m really happy with these numbers and this tells me to continue writing more posts in the future.

Article views
While I did write one article less than the year before, I put more effort into the articles themselves. I had a lot of fun writing the posts and tried to include more interactive examples and demos where possible. This makes the posts more engaging and hopefully more useful for the readers and I plan to continue this trend in the future. Maybe I’ll even try a full animation framework?
But let’s see how the individual posts performed:

The colors are randomly assigned and do not have any meaning this time.
As you can see it’s a mixture of new posts and evergreens. Even my very first post still got some more views this year.
Users and their preferences
Device types

Regarding the device types there is not much change compared to last year. The number of tablet users is still negligible while the other two categories got all the additional visitors.
As I wrote last year, I added a small tracking pixel to the blog to also track visitors that do not execute any JavaScript (like RSS-feed readers). But I didn’t see a significant improvement in the number of tracked visitors this way.
Theme preference
Within the last month, I found out how to track the preferred theme (and font) of my visitors as well using custom dimensions in Matomo. So far I only have data for December, but the results are the same as on my portfolio:

Similarly I added a custom dimension to track the preferred font (serif vs. sans-serif) but so far there is no single data point for serif. Let’s see if this changes in the future.

Language preference
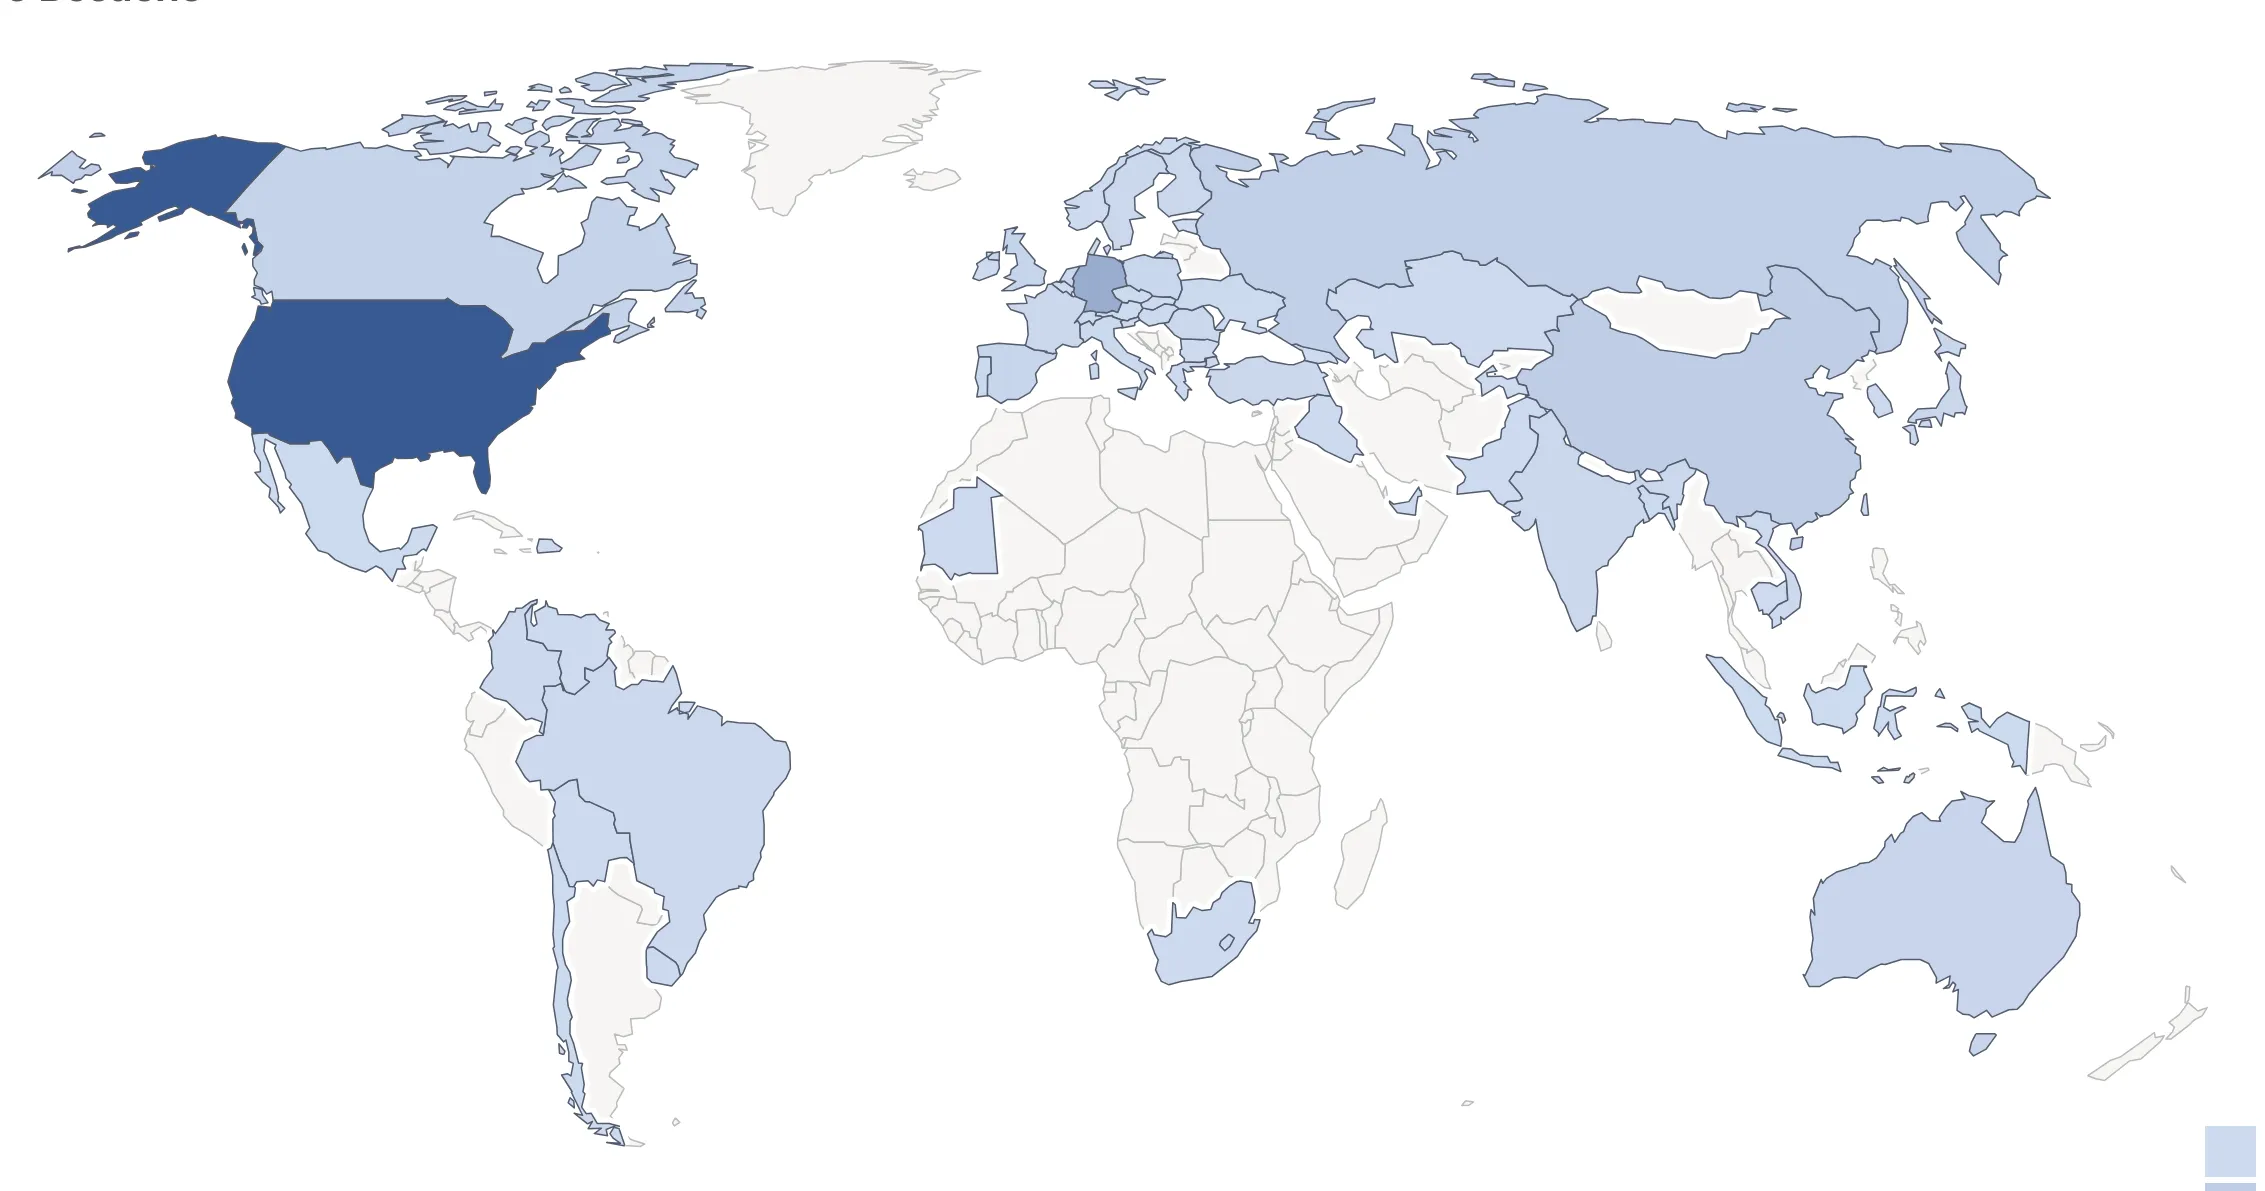
And the last thing I want to look at is the preferred language of my visitors. In contrast to all other data points, this one is the least useful. All of the articles are only available in English (which hopefully most people in this field understand) and there is no plan to translate them into other languages. Nevertheless here is the breakdown of preferred languages:

And again I have a corresponding world map for this data:
Other projects
But this year I also worked on a few other projects that have some statistics that are worth mentioning. So let’s take a look.
npm packages
By now I have published three open source npm packages that are available for everyone to use. Two of them are an Astro content loader to fetch data from PocketBase and an additional Astro integration with dev tools, both of which I’ve also published articles about. The third one is a MCP server to load markdown resources (no blog post yet 😉), which we use at work to give AI agents additional information about our frontend component library.
Here are the yearly npm downloads and GitHub star counts for each of these packages:
| Package name | Downloads | GitHub Stars |
|---|---|---|
| astro-loader-pocketbase | 8,843 | 53 |
| astro-integration-pocketbase | 4,253 | 12 |
| markdown-mcp-resource | 824 | 0 |
CardStore
Besides the TypeScript projects, I also started working on a new Android app after years of inactivity building mobile apps. CardStore is a digital card wallet for storing all kinds of cards like membership cards, loyalty cards, gift cards and more. Basically everything that has a barcode or QR code on it. It’s been a fun project to work on and I still have some features planned for the future.
But for now, here are some stats about the app:
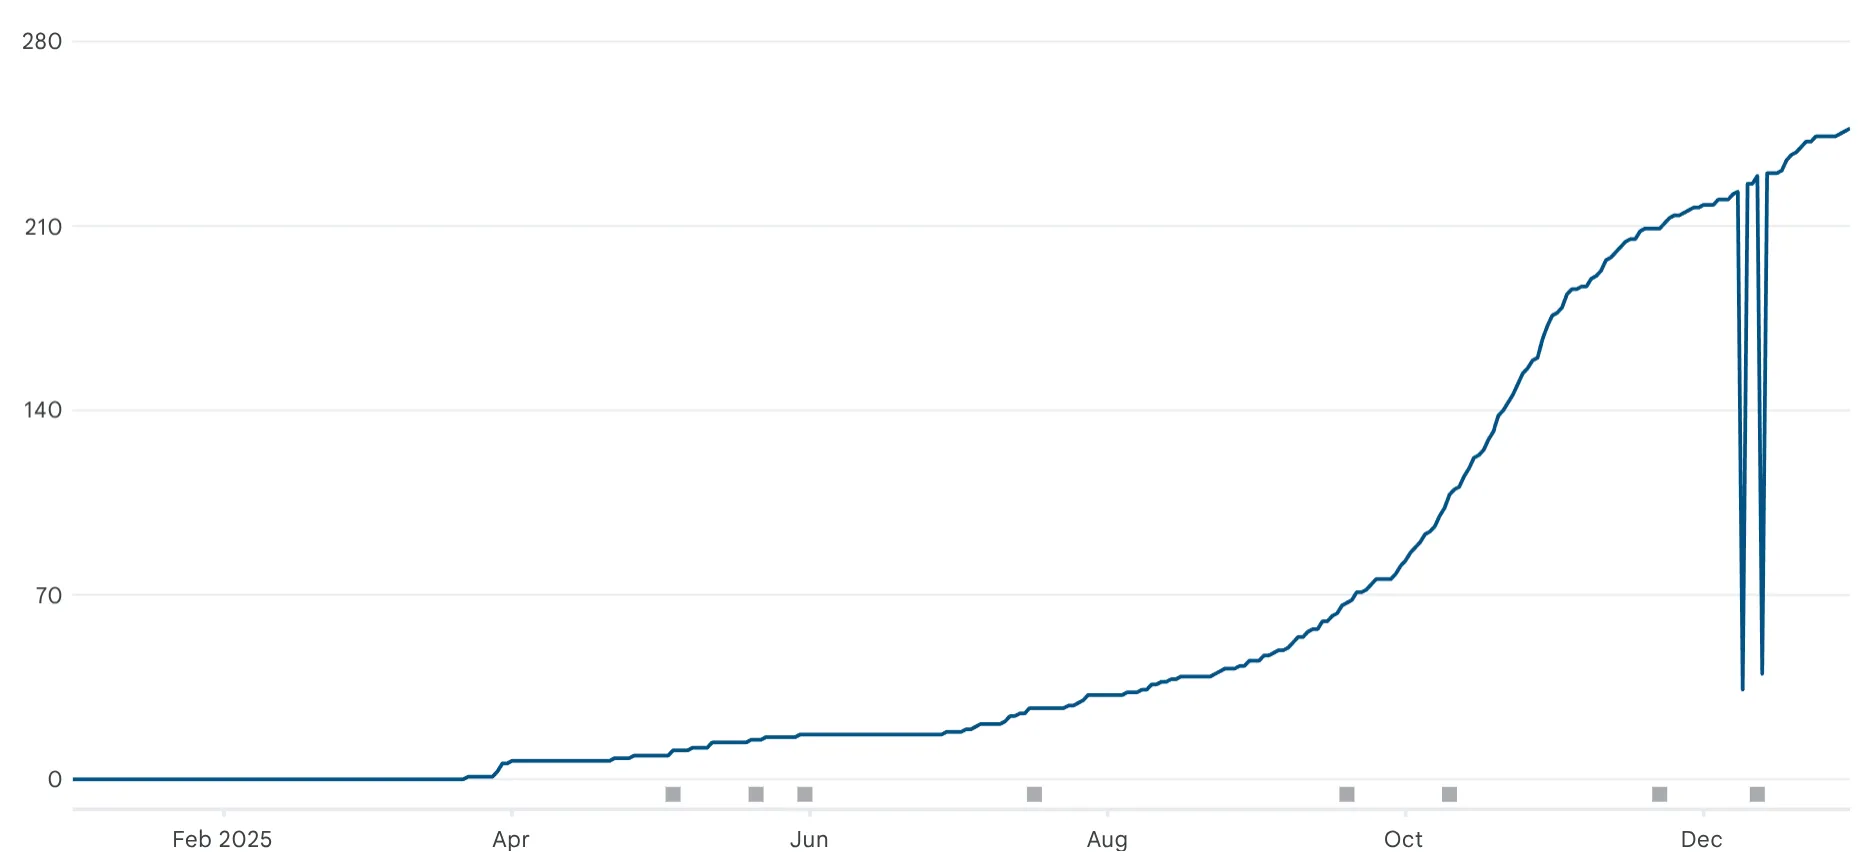
I have no idea what these dips in the graph are. Sometimes PlayStore Console is just buggy.
In total it was installed around 247 times with currently around 81 monthly active users on around 116 active devices. While it still has only one rating (with 5 stars though) and no reviews yet, it also has no crashes reported so far. So I’m really happy with the initial results and I hope to see more people using it in the future.
What’s next?
It’s been a great year 2025 and I’m always looking forward to the new statistics at the beginning of the new year. Especially to see how the projects performed compared to the previous year(s). So I’ll continue to collect this high level data on my projects and will also share it with you again next year.
I hope you enjoyed these insights and have a great year 2026 🚀!
As what’s next for me and my projects: I don’t know yet, but I still have a few ideas and blog posts in mind that I want to work on.
Want to see the insights of the year 2024? Checkout last years post linked below.